these graphs ?


Nope.
Go to status → Speedfusion find the tunnel and click the little chart button next to it
![]()
. That pops a new window that shows real time low level Speedfusion traffic characteristics. Like this:
1 Like


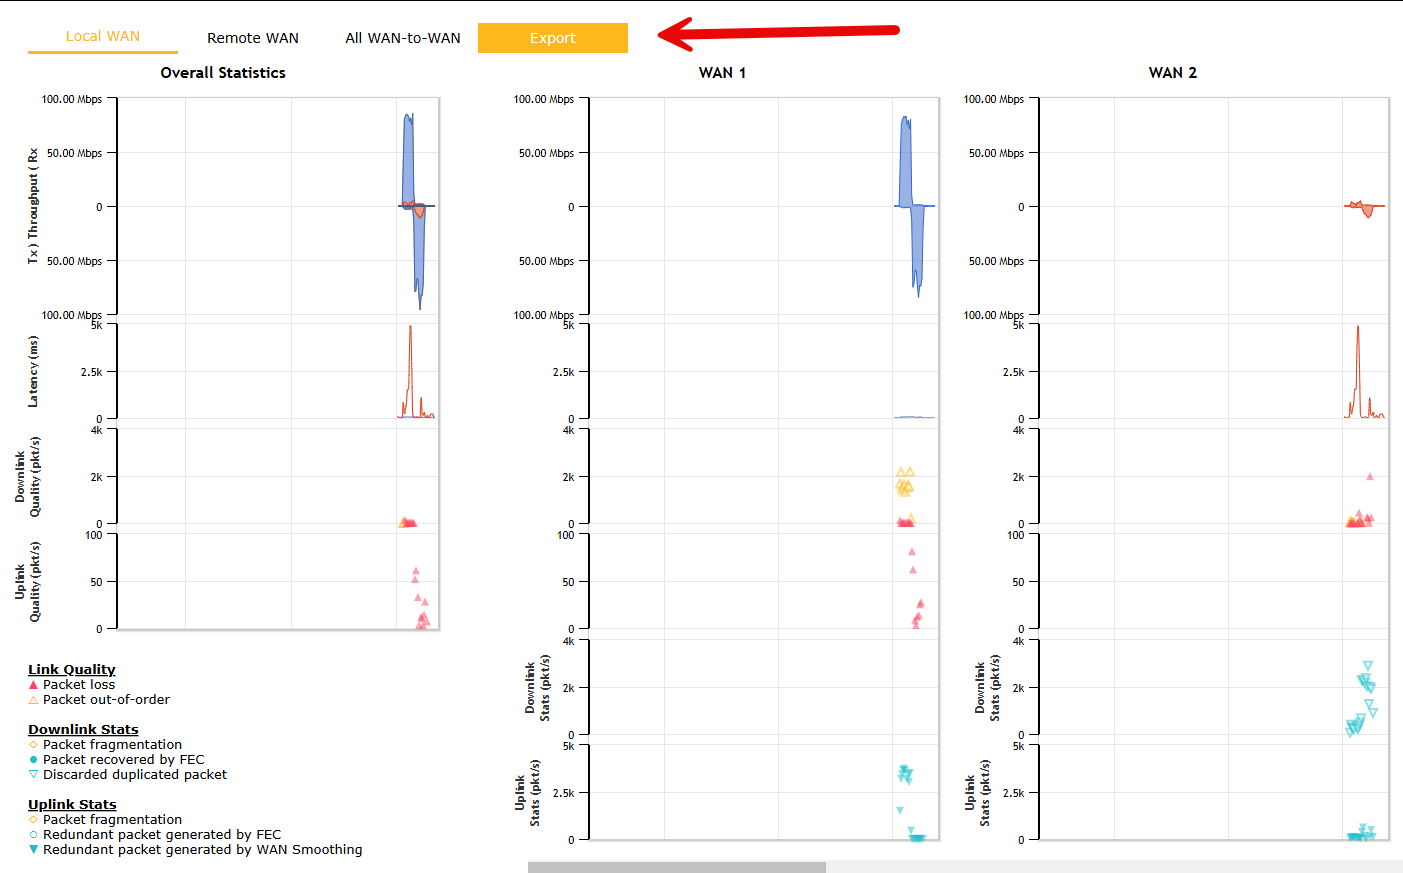
Lots to see here… these links are nasty ![]()
- Bonding is happening Purple WAN looks like it is higher quality than Blue WAN + Red WAN
- latency is quite high but stays nicely within a narrow range of 110-140ms it looks like. Do you often see spikes higher than that? latency cut off won’t make an impact here unless there are spikes higher than this.
- There is a ton of download packet loss. But a little less than we can see on the visible WANs (5 + 6) Do you have FEC enabled on the remote Hub or just DWB?
- uplink packet loss is being greatly improved by FEC and WAN smoothing
- tons of packet loss and packet out of order levels are high. Are these P2P wireless links?
- Same as 5
- Packet loss - lots of packet loss
- Same as 7
- we see WAN smoothing and FEC working hard here - the greatly reduced packetloss (seen at 4) shows its working well
- There is a surprising amount of packet fragmentation. If these are wireless links I suspect you might benefit if you lower the MTU value on your WAN profiles. Try setting them to Auto and see if that improves things.
2 Likes